It feels like with each passing year the stakes rise for predicting and managing risk. Does the universe need to keep dishing us market, environmental and health crises when regulated industries are amid massive digital transformation and analytic platform modernizations?
The insurance industry is facing down the compliance deadline for the FASB’s Long Duration Targeted Improvements (LDTI). Public carriers should be on the cusp of final transition to running new models developed over the past two years.
Similarly, most financial institutions should have their Credit Expected Credit Loss (CECL) compliance transitions in the rearview mirror. However, many credit unions have yet to reach key milestones toward implementation of the new credit standard.
And for private and smaller entities just now converting new roadmaps and processes into trial implementations, what are the lessons learned from their larger counterparts to help smooth the process?

Timing, business considerations and the scope of modernization may vary among companies impacted by new regulatory standards, but there is one unavoidable similarity: all will surface analytics gaps. Deadlines can’t be missed, but issues must be addressed. All that’s left is determining how and when.
Over the coming months, I will highlight some common gaps we have encountered while building analytics platforms for clients to help guide you through updates in your LDTI or CECL compliance strategy – whether it’s prioritizing your post-deadline improvements or anticipating and addressing gaps on the way to implementing new models.
Analytics platforms built to meet regulatory requirements and accounting standards (LDTI, CECL, IFRS 9, IFRS 17, CCAR, etc.) inevitably exist with common gaps that can lead to trouble down the road. Addressing the root cause of these flaws can result in more than better risk assessment and refined forecasting. They can help you run a smarter business. Some gaps include:
- Historical data flaws
- Manual preparation of external data (econ, auxiliary internal data)
- Stress testing with the same regulatory models
- Calculating and/or allocating adjustments
- Publishing results
All these gaps introduce potential exposure to deficiencies in IT or business controls over the platform and the business process of reporting a forecasted exposure and ultimately the reserve calculation. At a minimum they will burden those responsible for each part of the regulatory modeling process (data prep, model development, model deployment, model execution, and reporting) with additional work in each reporting cycle.
Addressing these gaps with controlled, automated processes will alleviate hours of manual work preparing data, adjusting models, and/or performing controls. When you solve gaps with automation you can gain back time to do more than the minimum with your platform and the insights it is generating.
We’ll start this blog series by focusing on historical data and data bounding methods that automate steps to prepare macroeconomic data in a time where forecasts were not characteristic of anything credit risk experts had previously encountered.
Facing down unprecedented data volumes for an unknown future
Source systems change, business acquisitions happen, and even if you have a master data management platform in place, there are inevitably sets of historical data negatively influencing your analytics and/or reporting workloads. The severity of these flaws is broad, but even minor flaws, such as a missing FICO score or an incorrect NAICs code, can have material impacts on loss forecasts.
Automation can correct these data integrity issues and add quality checks leading to more accurate and reliable model results and reporting.
Whether it’s uncharacteristic results, unexplained issues with account-level input data, or issues/changes with supplemental input data, the process of understanding the cause of issues is time consuming. Tracing results back to input data, and then tracing these data back to their source systems often takes more time than running the regulatory reporting process end-to-end.
We’ve been in the trenches trying to understand anomalies in input data and model results, and we know all this does is take away from the time needed to understand the correct results, come up with recommendations for adjustments, and present to the compliance committees. Corios has seen real world benefits for our clients by building checks and balances and implementing dynamic, yet controlled, processes to account for anticipated issues along the analytics pipeline.
The use case I’ll highlight here is one regarding the bounding or massaging of macroeconomic forecasts. This process may have several different names, depending on your organization. Here I’m specifically referring to the process of manipulating the macroeconomic series that drives regulatory forecasts.
A model for shifting from unbound to bound data
With the right combination of forces, historical data leveraged into current bound data sets will produce insight-driving analytics. The key is pinpointing how and where the data can co-exist and work in concert in your roadmap and models.
It’s important to establish the most relevant connection points and parameters. In most cases, we are implementing a ceiling and/or floor to raw or transformed macroeconomic variables, such as national GDP, quarterly change in employment rate, or month-over-month change in oil prices. Like it or not, models can only be informed by what has happened in the past.
When a global economic event occurs that causes macroeconomic forecasts to behave unlike anything seen in history, let alone the historical training set, strange things are bound to happen. In the relatively short time new credit risk accounting standards have been in effect, several events have driven global and local economic volatility, the likes of which have not been seen before.
Any global event will have wide-reaching market impacts as well as impacts to specific industries that are not duplicated elsewhere. For instance, the COVID-19 pandemic is an example of a global event that drove extreme volatility in macroeconomic forecasts that directly influenced credit risk models. The Russia-Ukraine conflict, natural disasters, and changing macroeconomic indexes by data providers have all led to volatility and a need for dynamic processes when preparing or using this critical input data.
The experience and skills to design such processes can be hard to find within a team or company. Adopting novel methods for tackling data gaps can require outside partners who bring not only experience with novel market events, but the absence of preconceptions about what the data can and cannot do.
In one specific case, a client needed to manipulate economic forecasts, because a handful of specific variables were so far beyond the threshold of any historical data used during development, that it was causing the models to predict a total loss for greater than 90% of some portfolios. While there were many reasons to anticipate some significant impacts to the economy, no one expected this degree of severity.
Once the driving factors for the nonsensical forecasts were understood, the next step was manipulating the economic data manually. This caused issues almost immediately. The controls for generating the data were compromised, which required new compensating controls. Clearly, we needed to automate the adjustment of economic data to ensure completeness, accuracy, and timely completion.
The root cause was the unprecedented month-over-month and quarter-over-quarter change in a handful of economic forecasts. To address this issue, we had a few options:
- manually manipulate the economic data file
- develop code changes to the economic data preparation process
- recode or recalibrate models
- set a ceiling and floor (bound) for the problematic forecasts within the models’ implementations
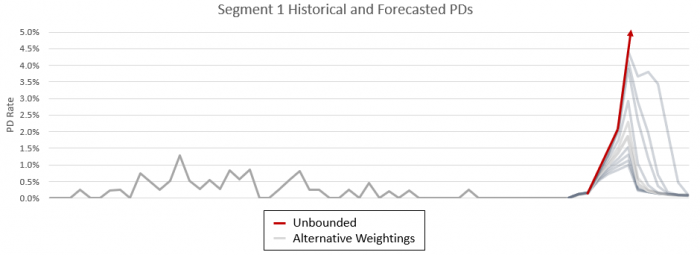
The most pragmatic way we have identified to implement these forecast adjustments is bounding transformed variables based on a weighted value of their historical maximum and minimum value. We then add the bounding parameters (maximum, minimum, and weighting) for use in the model implementation, as indicated in the graphic below.
In other words, the model was slightly modified to only use the raw economic data if the value is within the weighted ceiling and floor, otherwise the weighted ceiling or floor itself is used. Some analysis is usually required to determine where inflection points occur, then these paraments are set in a lookup table.
The process of bounding can be easily activated or deactivated by using different versions of the lookup table. The models will first try to use the bounded values, but if the bounding is not active, then the raw values will be used. This is a global setting for the series, simplifying the process and number of inputs. Horizon level bounding could be implemented; however, this brings unnecessary complexity into the data preparation process and model inputs.
Often, we find the simplest solution, when all aspects of the process are considered, is the best solution. Some might opine that the simplest intervention would be to manipulate the economic data directly. This, however, brings in many collateral complexities when you consider the need for controlled data preparation processes.
And we specialize in remedies for the complex. In this case bounding was the most practical solution, because it only required a few simple code changes and a small lookup table with four columns and one record for each of the impacted modeling segments.
Gap-free analytics platforms without the data mystery
Using a parameter file to activate/deactivate bounding, set values, and set weightings is a pragmatic, controlled approach to addressing a problem many didn’t see coming but will undoubtedly occur again. Regardless of if it’s this gap or another chasm in the data, getting to the core of issues is the start of framing corrective steps that put the data back on the predictive track.
When your LDTI and CECL compliance is stable, you’ll need to prepare for the next standard – inevitable with the rapidly increasing environmental and health-related risks to the markets. We have found consistent success in building platforms with automated data integrity and quality checks, flagging issues before they enter the system. Building dynamic processes to account for these issues also goes a long way in enabling the users to take matters into their own hands.
Better builds reduce client time spent on the endless odysseys searching data and running models to no avail and bounding has been proven to yield more reliable model results and reporting. So once the mystery is solved, the real fun in data storytelling can begin.